Which Stats Actually Predict Wins for the Chelsea Women's Soccer Team
Testing whether underlying performance metrics explain Chelsea Women's Football Club results (Chelsea FCW), and flagging games where they overperformed or underperformed those numbers.
What I'm digging into
Match results don't always reflect how a team actually played. This project asks which underlying metrics, xG, xG differential, shot quality, best explain Chelsea FCW's wins, draws, and losses across their 2023/24 WSL title-winning season. It also identifies specific matches where the results diverged sharply from the underlying numbers.
Where the numbers come from
StatsBomb's free open-data release for Chelsea Women's 2023/24 WSL title-winning season, pulled via the statsbombpy package. This is rich, event-level data (over 3,000 tracked actions per match) where each individual shot carries an xG value from StatsBomb's own model. It's a higher-quality data source than most publicly available soccer stats.
This file is event-level data that has to be aggregated up to match-level summaries, which is itself a realistic analyst skill, rolling up granular transactional data into the shape an analysis actually needs.
Limitations: The free release currently covers select WSL seasons only, so this analysis focuses on the 2023/24 season. Sample size is limited to one team's matches in one season.
How it works
- 1
Pull match list and event-level data via statsbombpy for Chelsea's 2023/24 season
- 2
Aggregate shot-level events into a match-level table, result as Win/Draw/Loss, xG for, xG against, xG differential, shot quality metrics
- 3
Profile and resolve data quality issues: team name inconsistencies, missing/null values in specific event fields, aggregation edge cases (own goals, penalties)
- 4
Test which metrics correlate most strongly with match outcome across all three outcome classes (W/D/L), not just win/loss
- 5
Compare actual goals scored vs. xG per match to flag specific games where Chelsea overperformed or underperformed their underlying numbers
- 6
Visualize findings in Python (matplotlib) with a headline scatter of goals vs. xG and model-fit visualization, both highlighting standout matches
Notable Conclusions
Goals vs. Expected Goals, by Match Result
Each point is one match. Color indicates result (win/draw/loss); the dashed line marks where goals scored equals xG exactly.
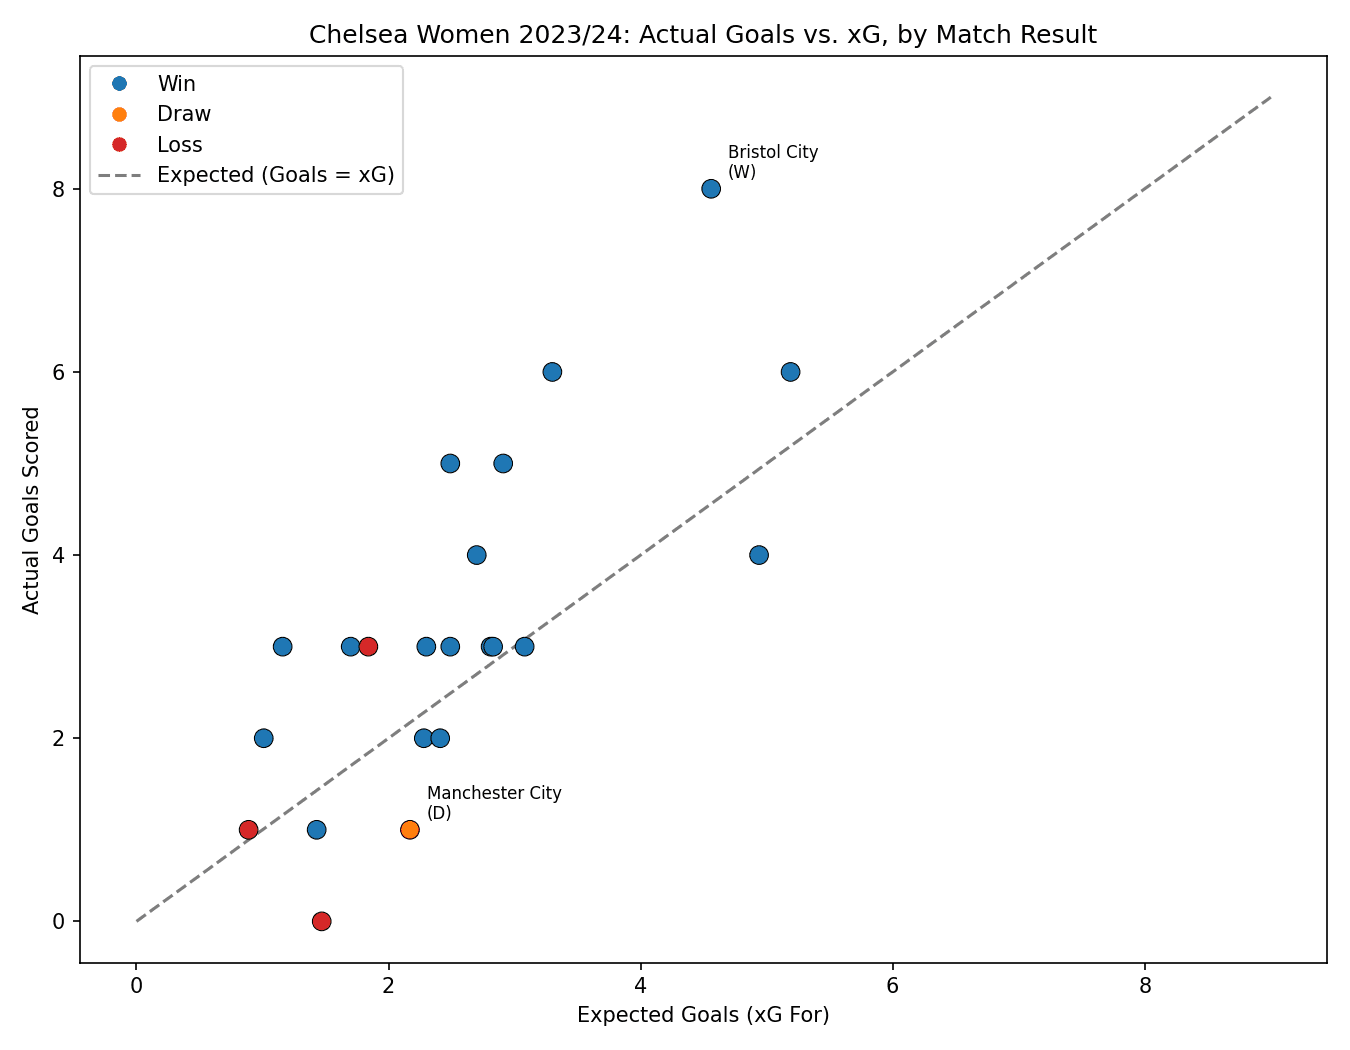
This visual is a plot of actual goals against xG per match, color-coded by result. Most points sit above the diagonal reference line, visually confirming Chelsea FCW's season-long attacking overperformance (+15.04 goals above xG). The labeled outliers including Bristol City (an 8-goal outburst on just 4.56 xG) and the Man City draw show the two extremes of this story. In one match, Chelsea drastically outscored their chances, and in a different match, strong underlying numbers didn't convert into a win at all.
Model-Predicted Win Probability vs. xG Differential
Logistic regression output plotted against the underlying metric it's built on, with actual outcomes color-coded.
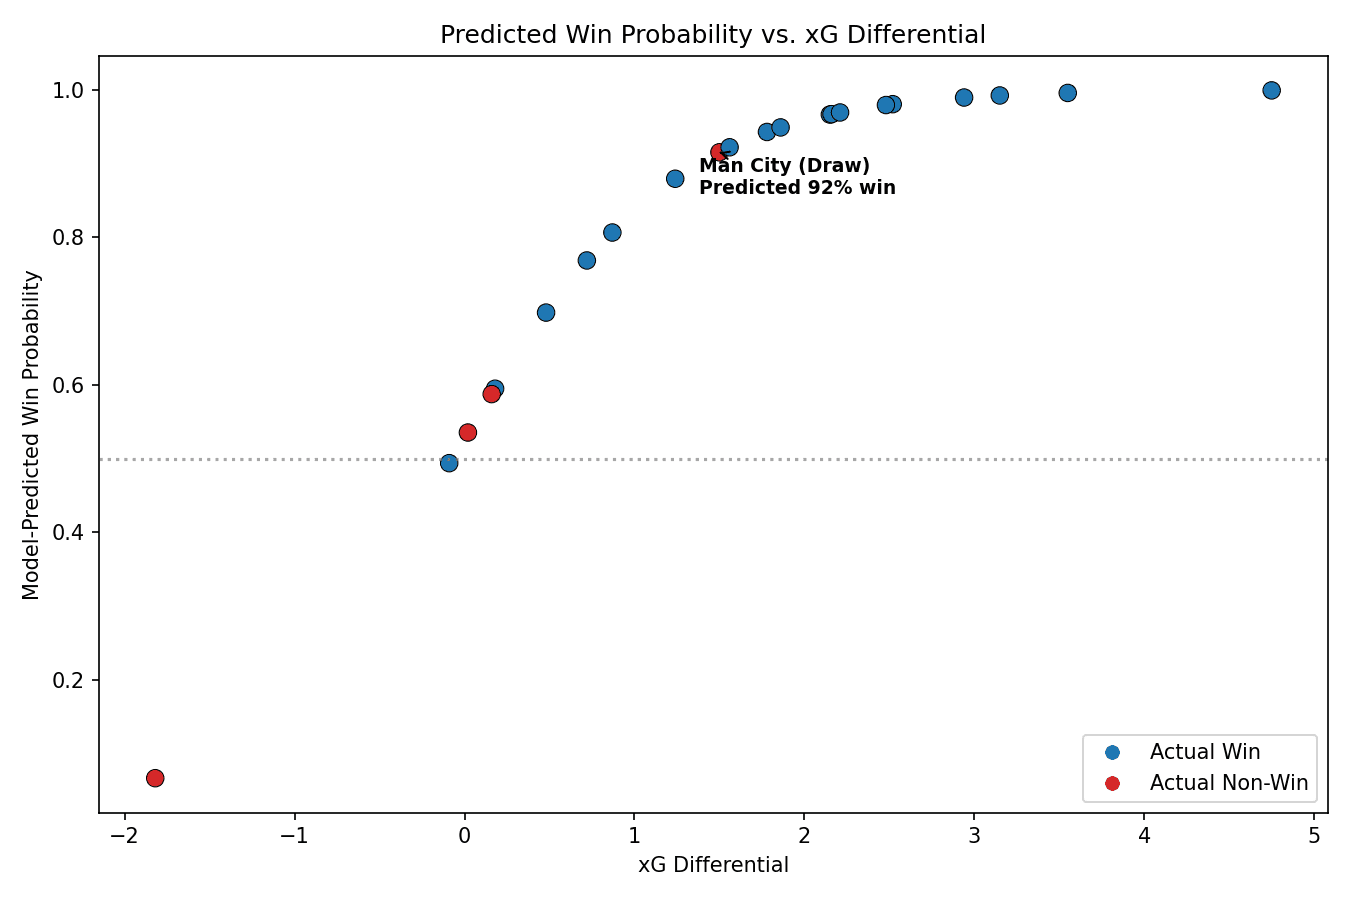
This visual shows the logistic regression's predicted win probability against xG differential, with actual outcomes color-coded. Higher xG differential clearly pushes predicted win probability upward, consistent with the model's significant fit (LLR p=0.007). The most important callout is the Man City draw. Despite generating a strong +1.50 xG differential, the model predicted a 92% chance of a Chelsea win, which makes this the single largest gap between underlying performance and actual result in the season.
What the data says
xG differential is a moderate, robust predictor of match outcome.
Across Chelsea FCW's 2023/24 WSL season, xG differential correlated with match result at 0.568, which is a meaningful but faulty relationship. This held up even after removing the season's biggest outlier (an 8-0 win over Bristol City), confirming it wasn't even driven by a single extreme match. A logistic regression modeling win probability from xG differential was statistically significant overall (p=0.007), with each additional goal of xG differential associated with roughly 4.5x higher odds of winning.
Chelsea overperformed their underlying numbers on both sides of the ball.
Chelsea scored 15.04 goals more than their cumulative xG predicted, while also conceding 3.60 goals fewer than their opponents' cumulative xG against predicted. This is an ~18.6-goal swing in Chelsea's favor beyond what shot quality alone would suggest. As a result, an open question is raised that this analysis can't fully resolve with one season of data: how much of this reflects genuine finishing/goalkeeping quality versus season-length variance.
The season's most notable result was a draw the underlying numbers said should have been a win.
Chelsea's only draw of the season came against Manchester City, in a match where Chelsea generated a +1.50 more expected goals than their opponent. The win-probability model, trained on the season's data, predicted a 92% chance of a Chelsea win for this exact match, which makes it the single largest gap between underlying performance and actual result in the entire dataset.
The bigger picture
Demonstrates the full analyst workflow for an exploratory data analysis project. Sourcing data that isn't handed to you in a clean API, validating, and cleaning it, modeling it in SQL, and communicating a stakeholder-ready insight. This is applied to a compelling, personal case study rather than a canned dataset.